Supplementary Materials *Updated 19 June 2020
Contents:
-
Reproduction of switching map with networks color-coded
-
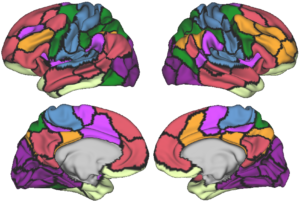
Visualization of switching ROIs
-
Number of ROIs switching between specific network pairs
-
Graphs of network connectivity measures by number of networks per region
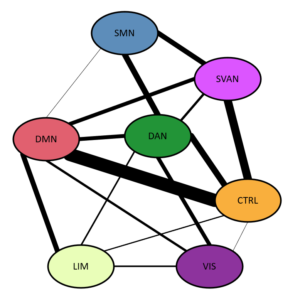
| Color | Yeo et al (2011) Network Label |
|---|---|
| Somatomotor Network | |
| Salience/Ventral Attention Network | |
| Dorsal Attention Network | |
| Default Mode Network | |
| Control Network | |
| Limbic Network | |
| Visual Network |
3. Number of ROIs that switch between specific network pairs:
| Network 1 | Network 2 | ROIs |
|---|---|---|
| Control | Default Mode | 23 |
| Control | Salience/Ventral Attention | 14 |
| Control | Dorsal Attention | 11 |
| Dorsal Attention | Somatomotor | 10 |
| Salience/Ventral Attention | Somatomotor | 9 |
| Default Mode | Limbic | 9 |
| Default Mode | Salience/Ventral Attention | 7 |
| Default Mode | Dorsal Attention | 7 |
| Dorsal Attention | Visual | 7 |
| Default Mode | Visual | 4 |
| Dorsal Attention | Salience/Ventral Attention | 4 |
| Limbic | Visual | 3 |
| Dorsal Attention | Limbic | 3 |
| Control | Limbic | 2 |
| Default Mode | Somatomotor | 1 |
| Control | Visual | 1 |
Participation Coefficient
Participation coefficient significantly increased from regions in one network to those in multiple networks (p1,2 & p1,3 < .001). This suggests that regions that were assigned to different networks across resolutions have stronger connections to more than one network than those that were consistently assigned to one network.
Within-Module Degree
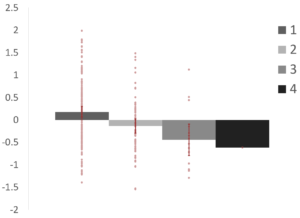
Within-module degree significantly decreased from regions in one network to those in multiple networks (p1,2 = .005; p1,3 = .012). This suggests that regions that were assigned to different networks across resolutions are more weakly connected to their assigned network than those that were consistently assigned to one network.